FUTUREMARK
Futuremark is a software development company that produces the world’s most popular benchmarks to measure the hardware performance of PCs, tablets, and smartphones.
BUSINESS GOAL
Futuremark’s mission is to educate users on the performance of not only their device, but other devices as well. Their benchmarks enable people to measure and understand a device’s hardware potential.
CHALLENGE
Improve the current 3DMark Android application to provide clarity about a device’s capabilities.
User’s can seamlessly run a benchmark and analyze results to understand how their phone competes with other devices in the latest 3DMark update.
RESEARCH
Survey
We conducted a survey to understand the primary needs of our users when it came to mobile benchmarking. From this survey, we were able to understand the importance of component-level and scenario-based tests, and learn that the main frustration from our users was the lack of cross-platform comparison.
The key insight was that our users found it challenging to understand what their benchmark scores meant.
Usability Study
Understanding the frustrations from our users during the survey, we wanted to understand their flow and thoughts while engaging with our application.
Users found it difficult to interpret the benchmark score and the relevance of the graphic.
Test scores and components were not understandable.
Graphs did not provide additional context to the score.
From our research, we were able to conclude the results page attracted the majority of the pain points during a user’s flow.
Design
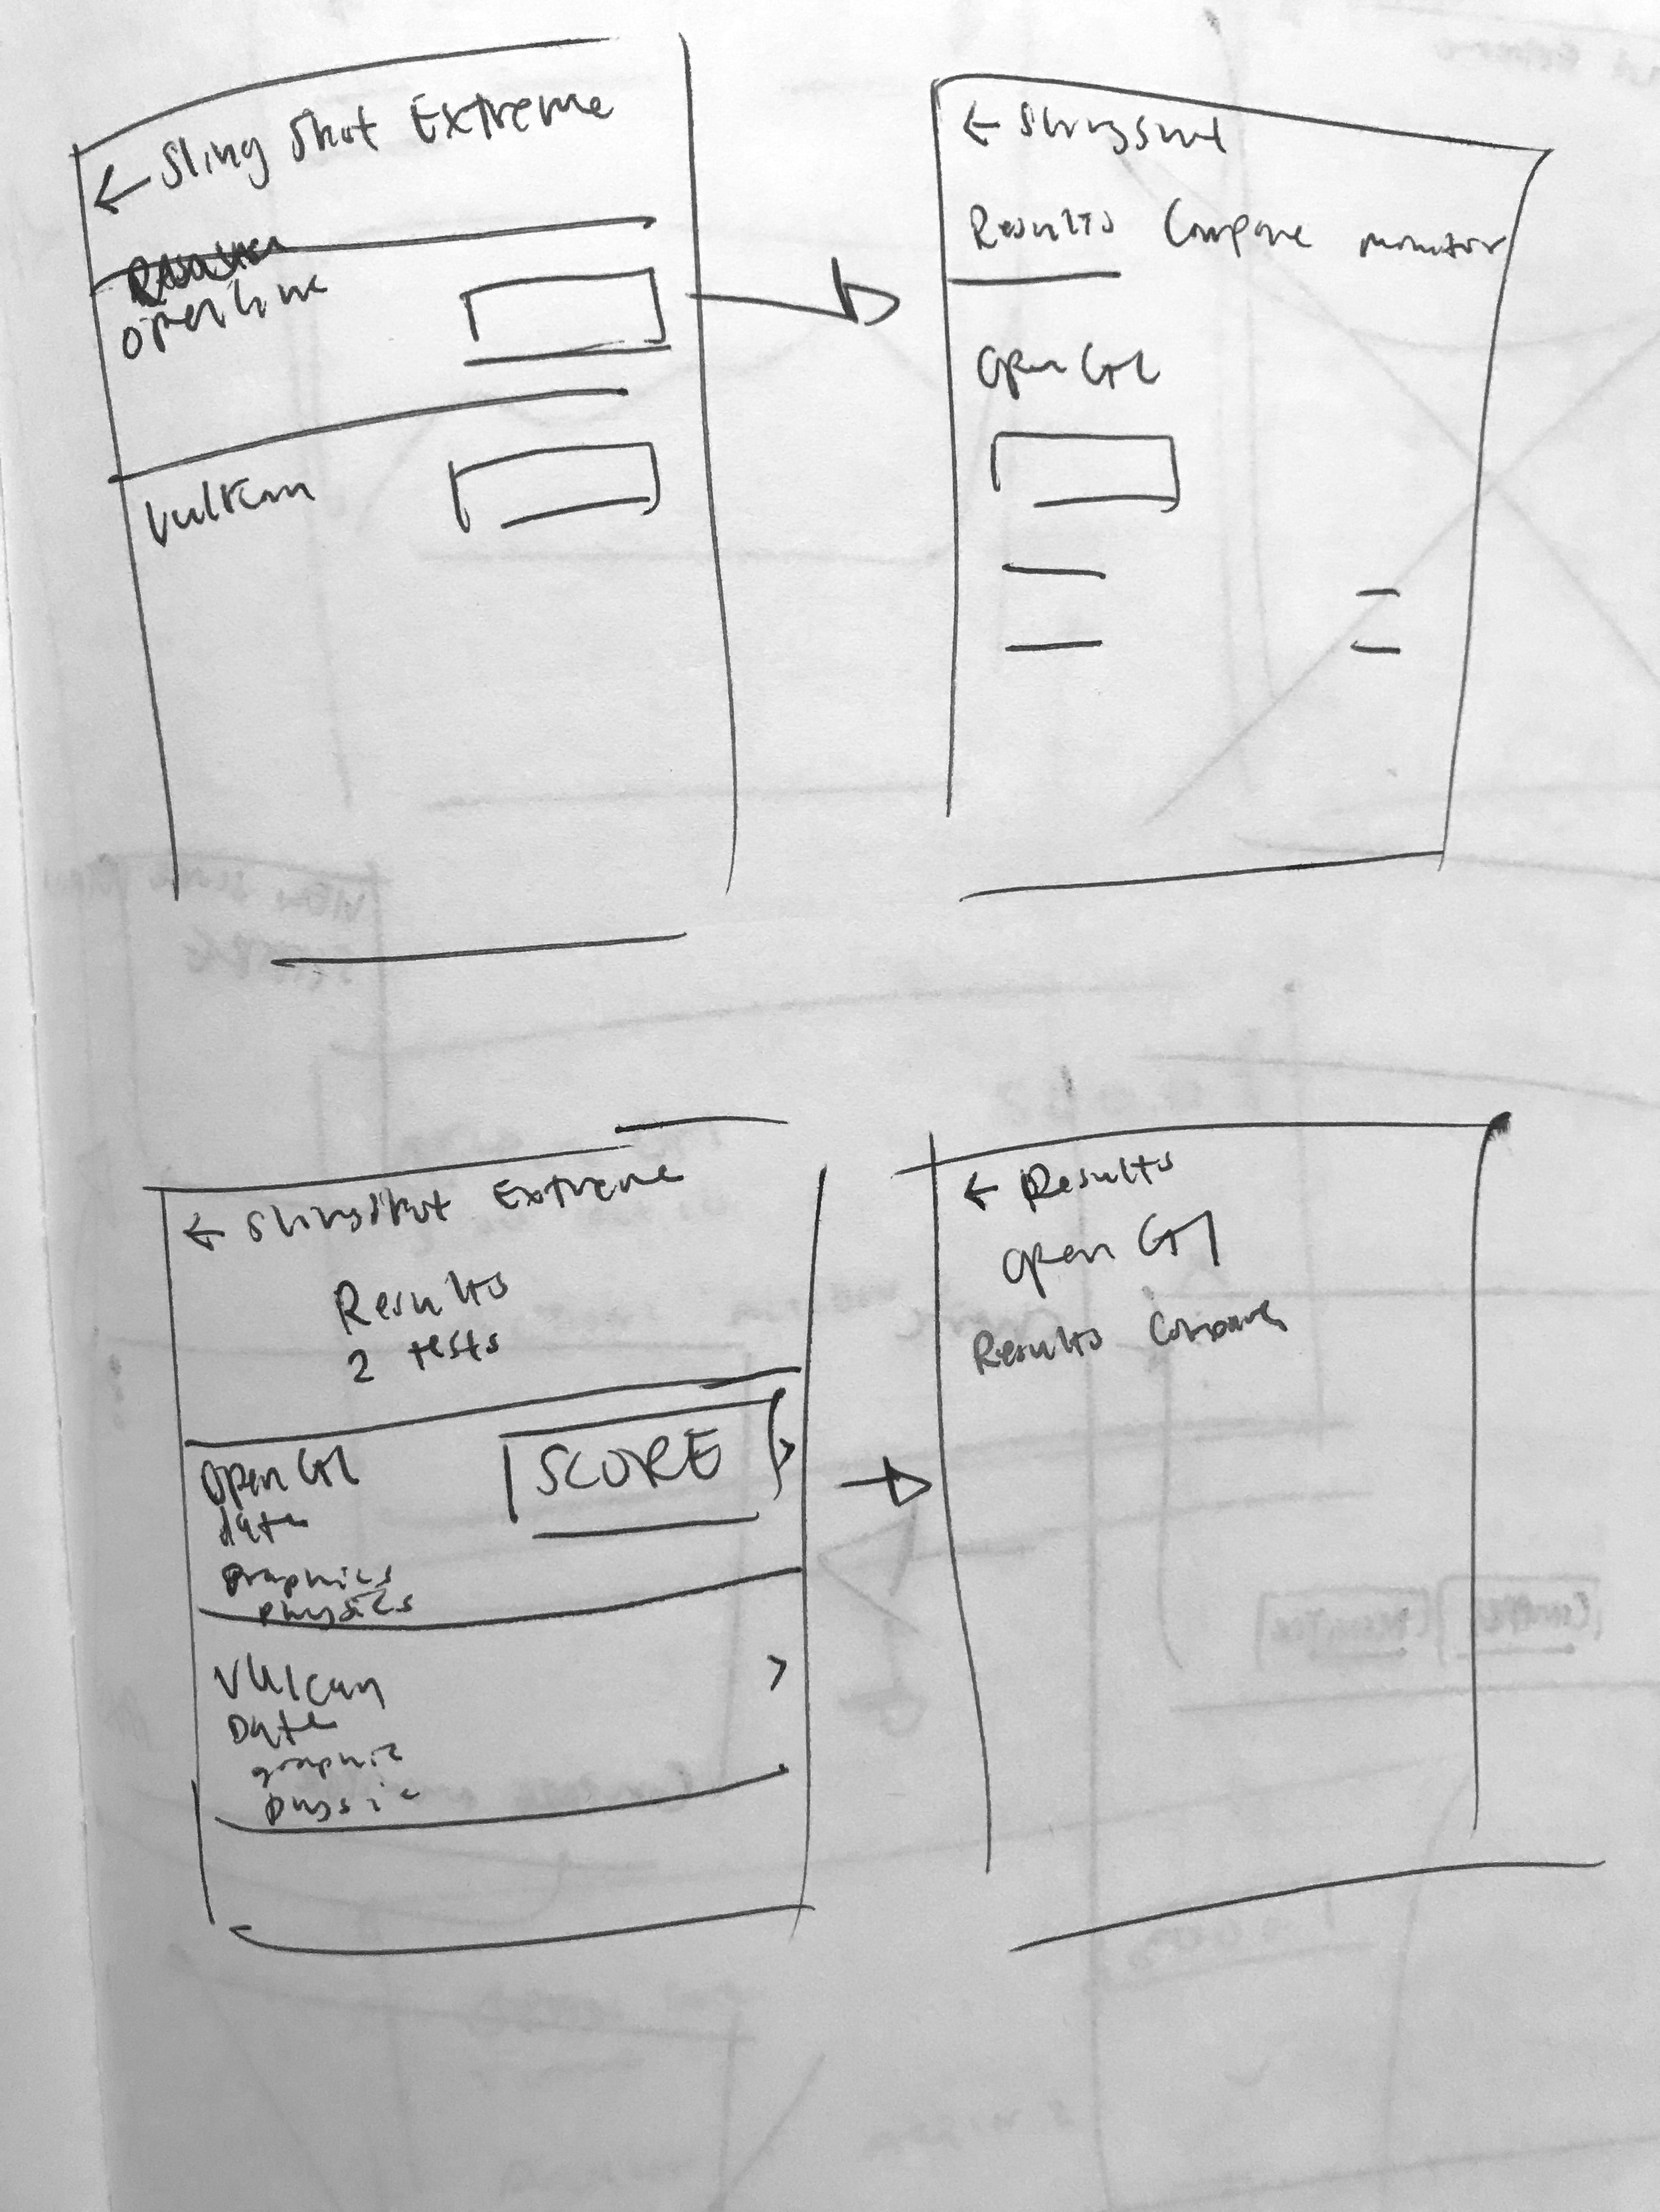
Redesigning the results flow, I had to keep in mind what attracted a user’s attention and how they interpreted the data provided. The main objective was to create a story about the performance of their mobile device.
When redesigning the results screen, we wanted to provide as much context as possible. After creating a few mockups, I tested the wireframes with users to gauge the current status of the design. All participants understood the information on the results page and 60% of the participants were more interested in comparing their device. Gaining this knowledge helped further the design to create the desired story for the user.
solution
The key findings from our research allowed us to understand the natural intuition of a user and what they found valuable within a benchmarking product. We were able to pinpoint that the main frustration for the user was grasping the meaning of their scores. This led us to designing a story with our results by providing more details to our data, which allows a user to understand how their device ranks with similar devices and other competitive devices on the market.
Left to right:
First screen: After a user runs the desired benchmark, they are given their results. Users may quickly glance at their score or choose to view more details.
Second screen: When a user views the details of their result, they are able to view a breakdown of their score, such as the frames per second within each test.
Third screen: On the same screen, the user is able to see how their device ranks with other devices of the same model.
Fourth screen: We have paired comparable metrics for the user to gain a better understanding of how specific factors can affect their device performance.


